Are you looking for the best TradingView Analyst Ratings Indicator to upgrade your chart setup? You are in the right place.
Imagine this scenario: Your technical setup looks perfect. The RSI is oversold, the MACD just crossed bullish, and the price is hitting a key support level. You buy the dip with confidence—and the stock immediately crashes another 10%.
Why did this happen? Because while you were zoomed in on the technical chart, the big institutional players were selling.
Technical analysis tells you when to trade, but it often ignores what the smart money thinks. This is why you need a professional TradingView Analyst Ratings Indicator directly on your screen.
In this comprehensive guide, I will show you why combining technicals with fundamental analyst consensus is the ultimate edge, and how our ChartAnchor tool automates this fusion for you.
What is a TradingView Analyst Ratings Indicator?
A TradingView Analyst Ratings Indicator is a specialized tool that pulls fundamental data directly onto your technical chart layout. TradingView aggregates buy and sell recommendations from major investment banks and analyst firms (like Goldman Sachs, Morgan Stanley, and JP Morgan) into five clear categories:
- Strong Buy
- Buy
- Hold
- Sell
- Strong Sell
Most traders constantly switch browser tabs to check websites like Yahoo Finance, MarketWatch, or TipRanks for this data. This breaks your flow. A proper TradingView Analyst Ratings Indicator solves this workflow problem by displaying the consensus rating and the price targets right next to your candles.
The Danger of “Technical Tunnel Vision”
Trading purely on technicals is like driving a car with one eye closed. You see the road (price action), but you miss the traffic signs (market sentiment).
If a stock has a “Strong Sell” consensus from 20 analysts because of bad earnings guidance or a fundamental flaw in the business model, a simple RSI divergence won’t save you. The long-term trend is driven by fundamentals and institutional order flow.
By using a TradingView Analyst Ratings Indicator, you add a crucial safety filter to your trading system:
- Confirmation (Green Light): If your technicals say “Buy” AND analysts say “Strong Buy”, you have high conviction. This is called “Confluence”.
- Warning (Red Light): If your technicals say “Buy” but analysts say “Sell”, the trade is risky. You should either reduce your position size or skip the trade entirely.
The Solution: ChartAnchor Consensus
We didn’t just want to display raw data. We wanted to build the best TradingView Analyst Ratings Indicator that actively helps you make decisions without cluttering your chart.
That’s why we created ChartAnchor Consensus.
It is not just a passive display panel. It is a hybrid decision engine that condenses complex market data into one clean overview.
How it works: The “Fusion” Dashboard
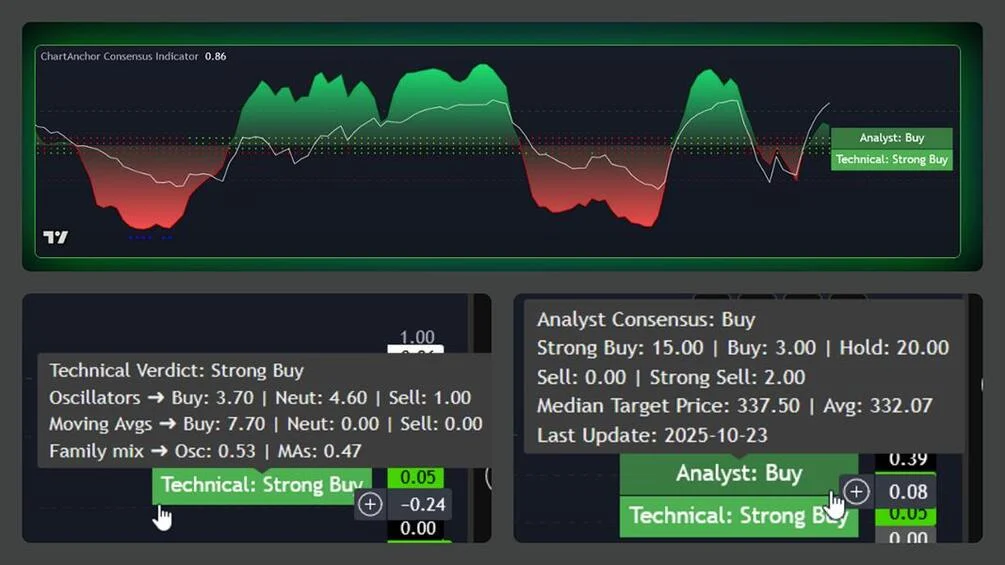
Most indicators force you to interpret complex lines. ChartAnchor Consensus gives you a clear, actionable summary directly on your chart.
You get a concise Smart Dashboard that stacks the two most important market drivers:
- Top Row: Analyst Consensus (What Wall Street thinks).
- Bottom Row: Technical Verdict (What the Price Action says).
Visual Confirmation at a Glance
In addition to the main dashboard, the indicator plots 4 Signal Dots right on your chart to give you instant feedback on the underlying drivers:
- MACD Momentum
- Stochastic State
- RSI Level
- Trend Direction (SMA/EMA)
When the Dashboard turns green and the Signal Dots align, you have a high-probability setup backed by both institutional sentiment and technical precision.
The Secret Sauce: Dynamic Weighting with ADX
A static TradingView Analyst Ratings Indicator is good, but markets change dynamically. Sometimes the trend is king, sometimes the range dominates.
We hard-coded a “Smart Logic” into ChartAnchor Consensus that no standard indicator has. It uses the ADX (Average Directional Index) to weigh technical signals differently depending on the current market regime. This ensures your technical score is always relevant.
- Trending Market (ADX > 20): When the trend is strong, oscillators like RSI often give false “Overbought” signals too early. Our script automatically gives more weight to Moving Averages (EMA/SMA). Trend-following signals dominate the score.
- Ranging Market (ADX < 20): In a sideways market, Moving Averages lag and produce false signals. The script shifts weight to Oscillators (RSI, Stochastic, CCI). Overbought/Oversold signals become the primary driver.
This means your technical signal adapts to reality, while the Analyst Rating keeps you grounded in the fundamental long-term view.
Step-by-Step: How to Trade with This Tool
Here is a simple workflow to integrate this TradingView Analyst Ratings Indicator into your daily routine:
- Check the Analyst Column: Before you even look at candles, glance at the ChartAnchor panel. Is the Analyst Consensus “Buy” or “Strong Buy”? If yes, you have a green light to look for long entries.
- Check the Technical Score: Now look at the Technical Verdict. Is it also green?
- Find the Entry: Use your standard price action triggers (like a breakout or pullback) to enter the trade.
- The Result: You are now trading with the trend and with institutional sentiment, significantly increasing your win rate.
Conclusion: Upgrade Your Charts Today
Stop guessing and stop switching tabs. Professional trading is about information efficiency and risk management.
By adding a powerful TradingView Analyst Ratings Indicator to your setup, you ensure that you never accidentally trade against the institutional consensus again. You get the best of both worlds: The precision of Pine Script technicals and the depth of fundamental research.
Ready to see the full picture?